
National Facilities


30
Sep
2023
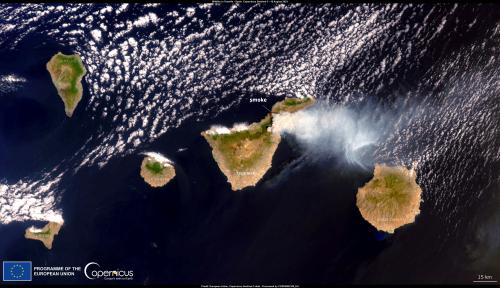
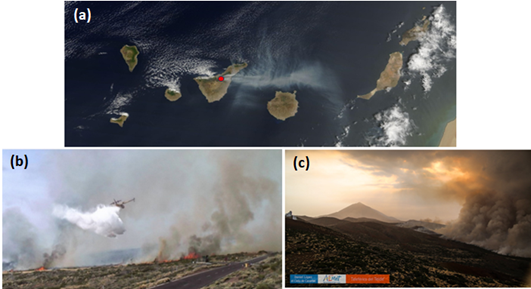
On August 15th, one of the most devastating wildfires in recent years on the Canary Islands began in the highlands of Tenerife. Although efforts were made to control it from the very beginning, it spread both to the north, towards the La Orotava Valley, and to the south, in the Güimar Valley, affecting 12 municipalities and over 12,000 hectares. Even on the evening of August 20th, the fire reached the Izaña mountain, where the Izaña Observatory (IZO) managed by the State Meteorological Agency (AEMET) through the Izaña Atmospheric Research Center (IARC) is located (Figure 1). However, thanks to the rapid response of firefighting resources, the fire was prevented from affecting any of the observatory's infrastructure, and in the following days, it was brought under definitive control.
Despite the intensity of the fire in the vicinity of the observatory, most of the IARC’s measurement programs remained operational. However, the impact of the fire was reflected in anomalies recorded in routine measurements of the World Meteorological Organization's Global Atmosphere Watch (GAW) programs, such as greenhouse gases and in-situ aerosols, which is also an ACTRIS National Facility, as well as other programs like column aerosols, radiation, and various atmospheric parameters measured at the station.
In the context of the GAW Greenhouse Gas Monitoring Program, the highest recorded CO2 value exceeded 500 ppm on August 17th (normal values measured at IZO range between 410 and 430 ppm) (Figure 2a), while the highest recorded values of CH4 and CO on August 19th were greater than 2,800 and likely over 10,000 ppb, respectively (Figure 2b, c) (normal values for CH4 range between 1,800 and 2,100 ppb, while CO values range between 50 and 200 ppb at the Izaña station).
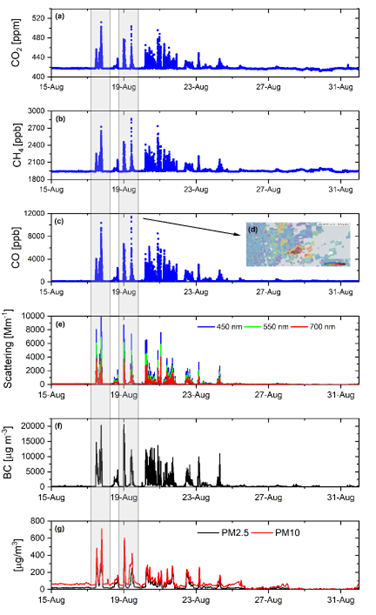
Measurements taken during the wildfire by aerosol property measuring instrumentation reached maximum values far from the typical values usually recorded at IZO, as shown in Figures 2 and 3. During the wildfire, the values of the scattering coefficient (Figure 2e) measured with the ACTRIS nephelometer 3563 and the values of black carbon content (Figure 2f) measured with the ACTRIS Multi Angle Absorption Photometer (MAAP 5012) reached the highest values recorded at the Izaña Observatory since records have been kept since 2012.
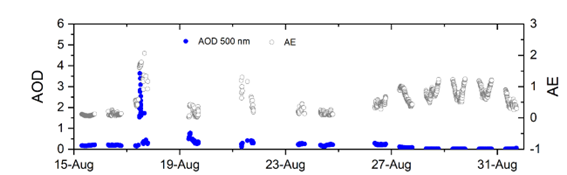
Figure 3 depicts the temporal evolution of aerosol optical thickness (AOD) at 500 nm and the Ångström Exponent (AE) parameter measured at IZO. The maximum values of AOD at 500 nm (AE) were 3.63 (2.14) and 4.16 (1.71) recorded on August 17th and August 20th, 2023. These values represent the highest AOD values ever recorded at the Izaña station since it became part of the Aerosol Robotic Network (AERONET) in 2005.
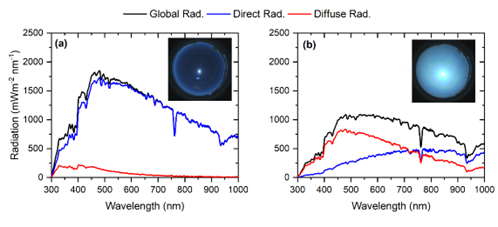
As part of the activities of the WMO Commission for Instruments and Methods of Observation (CIMO-Testbed), spectral global, direct, and diffuse radiation measurements taken with the EKO-RSB spectroradiometer at IZO were significantly impacted during the wildfire. Figure 4 illustrates the differences between measurements under clean atmospheric conditions (August 6th; Figure 4a) and those affected by the wildfire on August 17th at 13:00 UTC (Figure 4b).
Once maintenance and cleaning tasks were carried out on all the observatory's instrumentation, it returned to normal operation at the end of August.